


Project Overview
Learning About Monte Carlo Simulations
In the ever-evolving world of finance, I embarked on a journey to understand and apply the fascinating concept of Monte Carlo
simulations to option pricing. This adventure took me through various libraries and resources, allowing me to explore the
intricate world of stock market simulations and option valuation.
My journey began with understanding of
Monte Carlo. At its core, Monte Carlo simulation is a technique that leverages random sampling to generate a
range of possible outcomes in a probabilistic model. So what better way then to learn it using a lecture available online:
Coding a Stock Simulation Program
After learning more about the process I found some libraries that could help me implement a Monte Carlo Simulation into code
and ways to get current data from Yahoo Finance. I then made a simulation program in Python which performs a Monte Carlo
simulation to model the performance of a portfolio consisting of multiple stocks over a specified number of days. The goal of
the code is to simulate how the portfolio's value might change over time, considering the historical mean returns and
covariance between the selected stocks.
The main way that this code works is that a loop runs for each simulation (m), where:
Random returns are generated based on the mean returns and covariance matrix using Cholesky decomposition.
The portfolio's daily returns are calculated by multiplying the random returns with the portfolio weights and adding 1.
The cumulative product of daily returns is calculated to simulate the portfolio's value over time.
The results are stored in the portfolio_sims matrix.
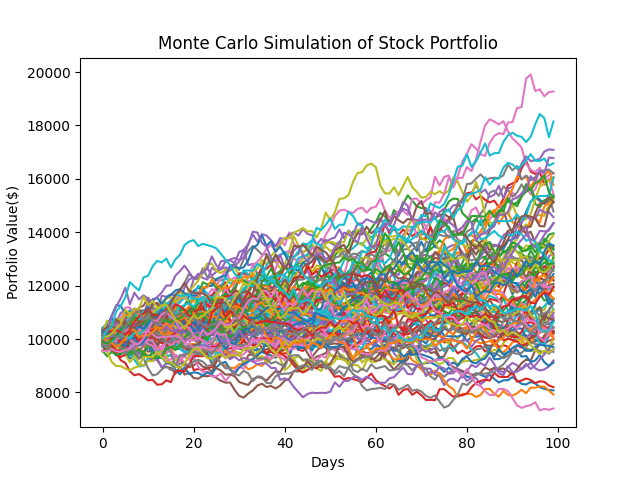
uses matplotlib.pyplot to plot the simulated portfolio values over time. The x-axis represents the number of days,
and the y-axis represents the portfolio value in dollars. The title and labels for the axes are added to the plot which is
displayed at the top of this page.
The next step in my journey is to learn about how the Monte Carlo Method is used to price options.